Transforming Production
Monitoring Through
Intelligent Telemetry
Technology
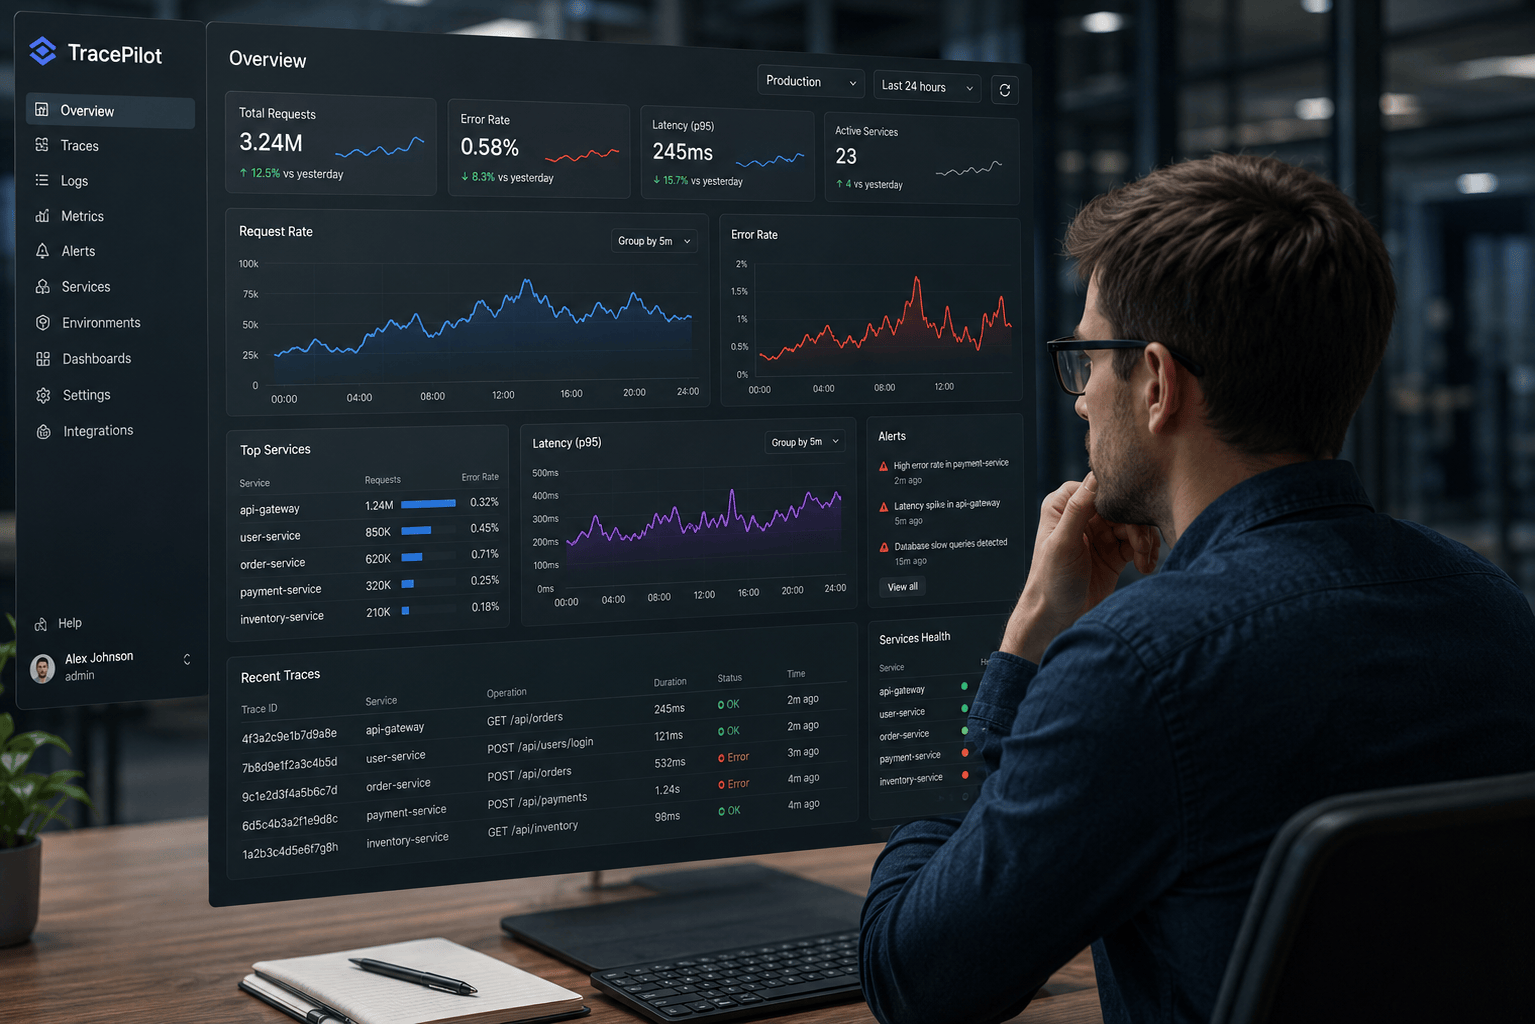
We engineered TracePilot to deliver production-grade observability for modern cloud-native applications. The platform unifies distributed tracing, performance profiling, real user monitoring, session replay, and automated error capture within a scalable architecture designed for high-performance production environments.
Client
Before adopting TracePilot, the client faced limited visibility into application performance across its distributed services, making it difficult to identify and resolve production issues efficiently. Engineering teams relied on fragmented logging and monitoring tools that lacked end-to-end request tracing between backend services and frontend applications, resulting in time-consuming debugging and inconsistent diagnostics.
The existing observability stack also lacked centralized performance profiling, Real User Monitoring (RUM), and session replay capabilities, making it difficult to understand how production issues impacted end users. Additionally, the team struggled to correlate deployments with performance regressions, leading to slower incident resolution and longer Mean Time to Resolution (MTTR).
To support a growing cloud-native infrastructure, the client required a unified observability solution that could consolidate telemetry, automate instrumentation, and provide actionable insights through distributed tracing, profiling, error monitoring, and user experience analytics—all while minimizing operational overhead and maintaining production-grade performance.
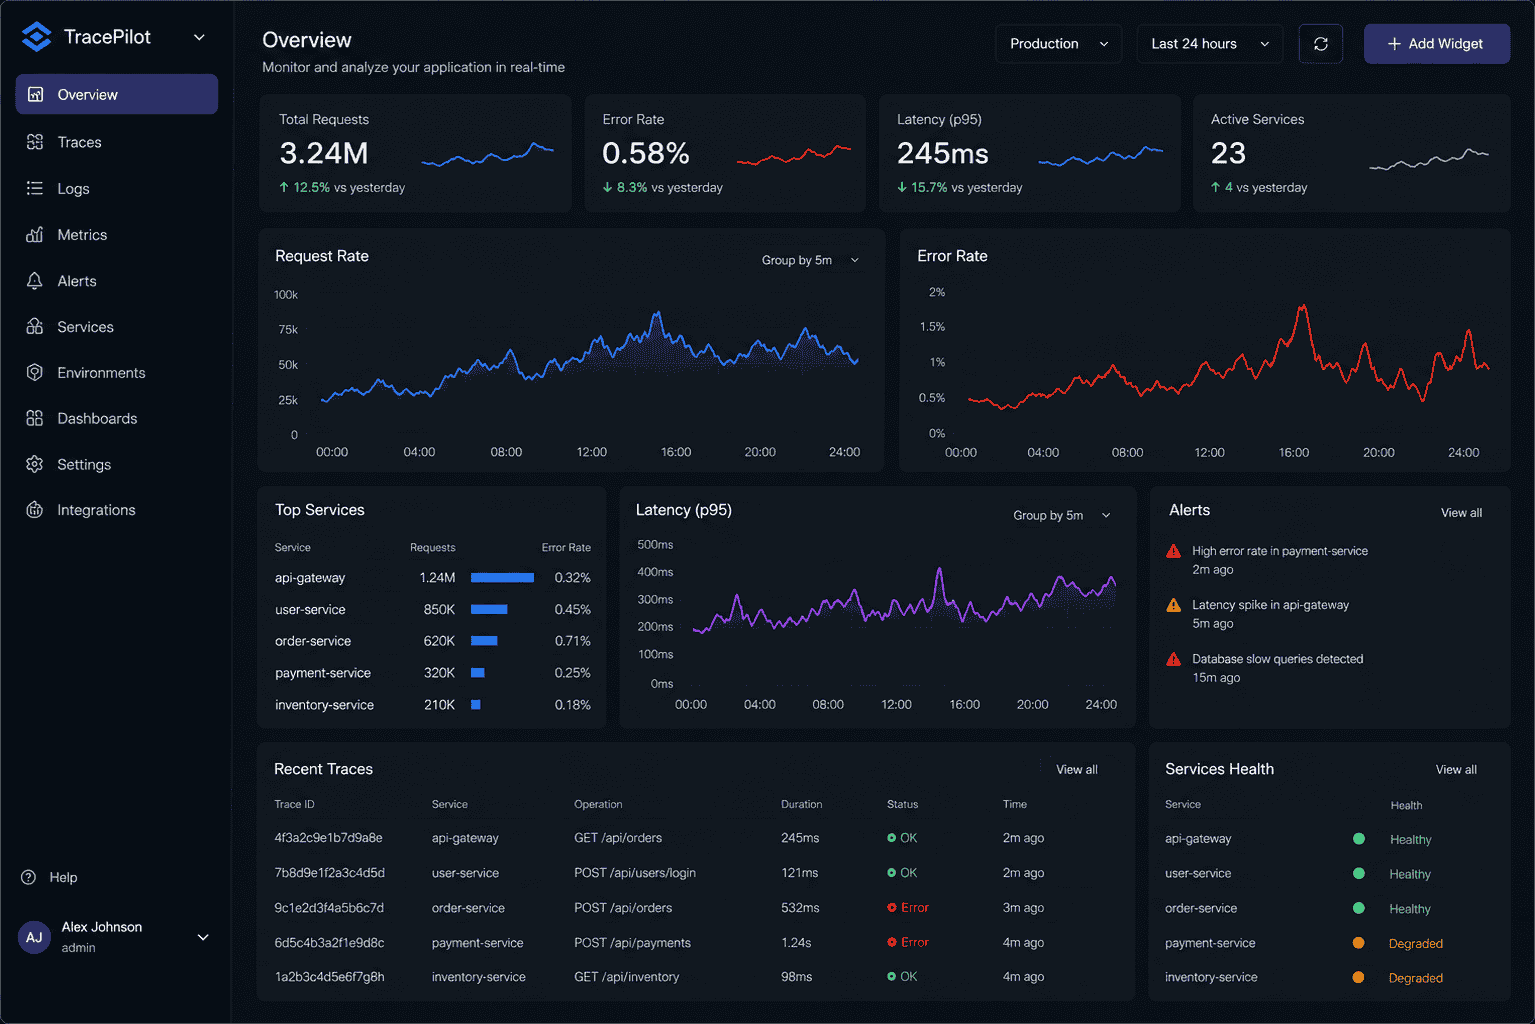
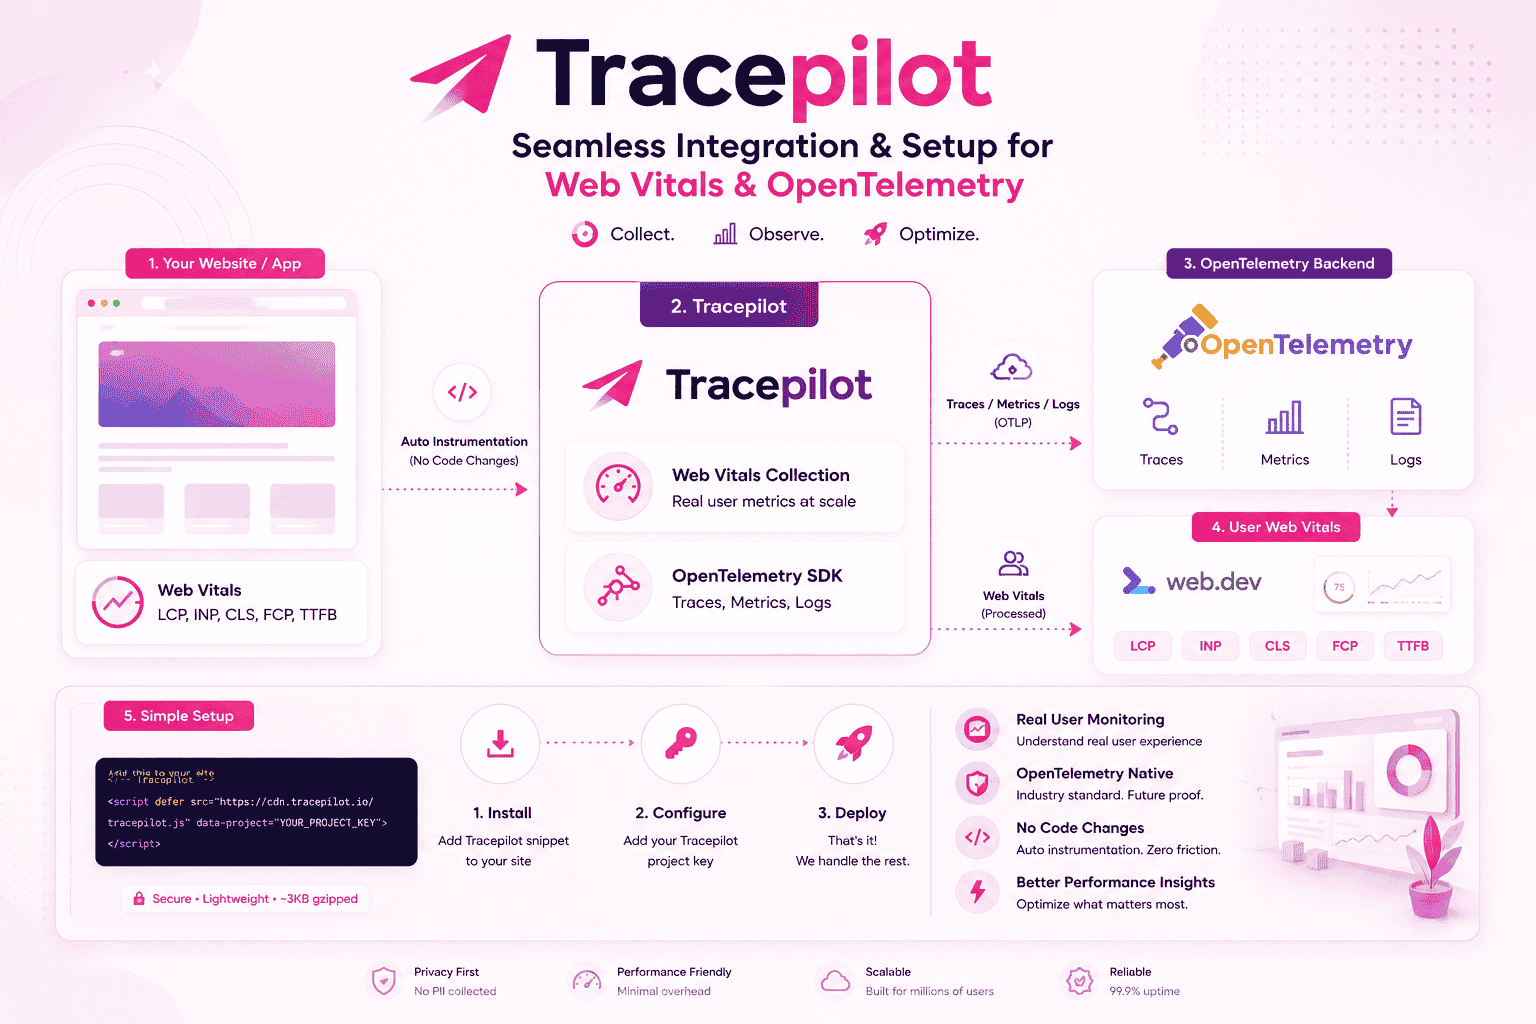
Image copyrights: Tracepilot SDK
Objectives
- Establish a unified observability platform by consolidating distributed tracing, performance profiling, Real User Monitoring (RUM), session replay, and error tracking into a single developer-friendly SDK.
- Accelerate debugging and incident response by providing end-to-end request visibility, automated error capture, and actionable production insights across distributed applications.
- Enable comprehensive full-stack monitoring with seamless instrumentation for backend services, frontend applications, and Edge runtimes to deliver complete telemetry coverage.
- Simplify developer adoption through a lightweight, production-ready SDK that abstracts the complexity of OpenTelemetry and requires minimal integration effort.
- Support modern JavaScript ecosystems with native integrations for Node.js, Express.js, React, Next.js, and Edge Runtime environments.
- Build a scalable telemetry pipeline capable of efficiently collecting, batching, and securely exporting high-volume traces, profiles, metrics, and session replay data with minimal runtime overhead.
- Improve application reliability and performance by continuously monitoring production workloads, identifying performance bottlenecks, and detecting regressions before they impact end users.
- Provide enterprise-grade security and scalability through authenticated telemetry ingestion, multi-environment support, intelligent batching, and a cloud-native architecture designed for high-throughput production systems.
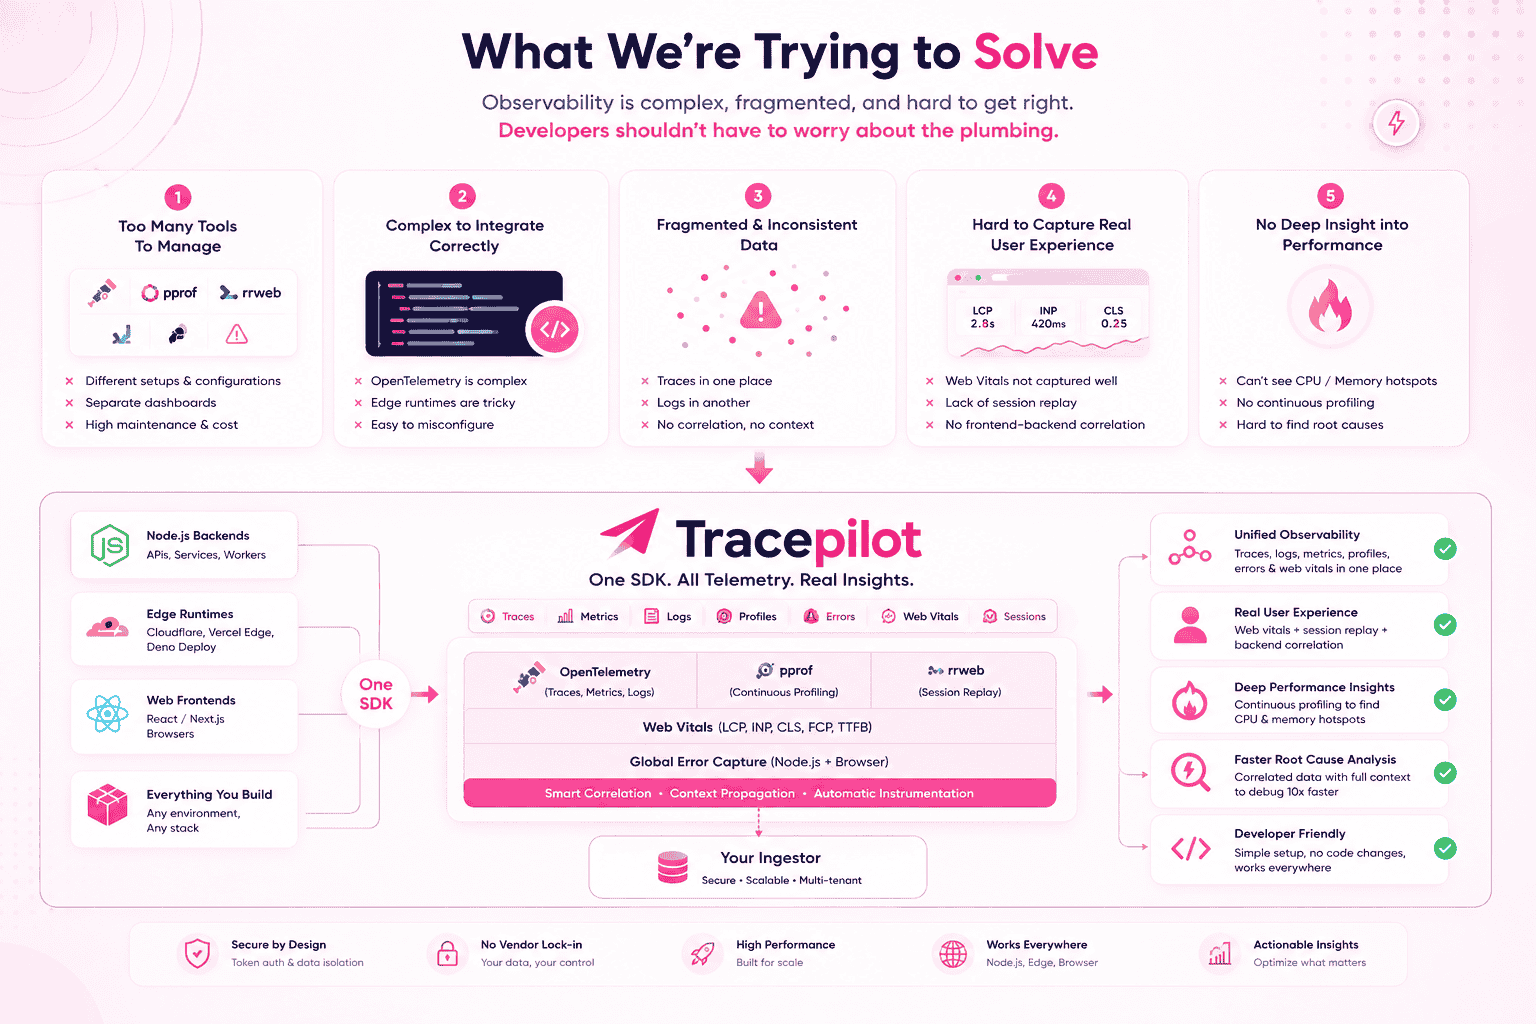
Image copyrights: TracePilot SDK
Discovery & Architecture
Before development began, we conducted a comprehensive assessment of the client's existing observability workflows, production infrastructure, and debugging processes to identify operational gaps and define the technical foundation for TracePilot.
Observability Assessment
Audited the client's existing logging, monitoring, and tracing ecosystem to identify visibility gaps, duplicated tooling, and areas for operational improvement.
Performance & Reliability
Analyzed production workloads to understand latency bottlenecks, error patterns, resource utilization, and the challenges affecting application reliability.
SDK Architecture
Designed a modular, developer-first SDK with intuitive APIs, enabling seamless integration while abstracting the complexity of telemetry collection.
Telemetry Pipeline Design
Architected a scalable ingestion pipeline capable of collecting, batching, processing, and exporting traces, profiles, errors, and user experience data with minimal runtime overhead.
Security & Data Strategy
Defined secure authentication mechanisms, encrypted telemetry transmission, environment-based configuration, and data privacy controls suitable for production environments.
Cross-Runtime Planning
Engineered the SDK to provide consistent instrumentation across Node.js, Express.js, React, Next.js, and Edge Runtime, ensuring a unified observability experience.
Scalability & Performance
Optimized the architecture for high-throughput telemetry processing using intelligent batching, asynchronous exports, and lightweight instrumentation.
Developer Experience
Prioritized ease of adoption by minimizing integration complexity, reducing configuration requirements, and delivering comprehensive documentation.
Image copyrights: Tracepilot SDK
Key Features
Advanced Observability
- Distributed Tracing – End-to-end request tracing across frontend, backend, and microservices to accelerate root cause analysis.
- Automatic Error Monitoring – Captures unhandled exceptions, runtime failures, and application crashes with complete diagnostic context.
- Continuous Performance Profiling – Monitors CPU and memory usage in production to identify performance bottlenecks with minimal overhead.
Digital Experience
- Session Replay – Reconstructs user sessions to help engineering teams reproduce issues and understand real user interactions.
- Real User Monitoring (RUM) – Collects real-world performance metrics and user experience data directly from browsers and client applications.
- Core Web Vitals Monitoring – Measures LCP, CLS, INP, FCP, and other critical web performance metrics to improve frontend responsiveness.
Enterprise Telemetry
- Intelligent Processing – Uses asynchronous batching, compression, and retry mechanisms to efficiently process high-volume telemetry with minimal overhead.
- Secure Pipeline – Implements authenticated telemetry ingestion, encrypted data transmission, and environment-based configuration for production-grade security.
- Multi-Environment Config – Supports development, staging, and production environments with isolated telemetry, configuration management, and deployment flexibility.
- Custom Business Events – Enables developers to capture domain-specific events and business metrics alongside application telemetry.
Developer Ecosystem
- Distributed Runtime Support – Native instrumentation for Node.js, Express.js, React, Next.js, and Edge Runtime environments.
- Developer-First SDK – Provides lightweight APIs, automatic instrumentation, and minimal setup, allowing teams to integrate enterprise observability within minutes.
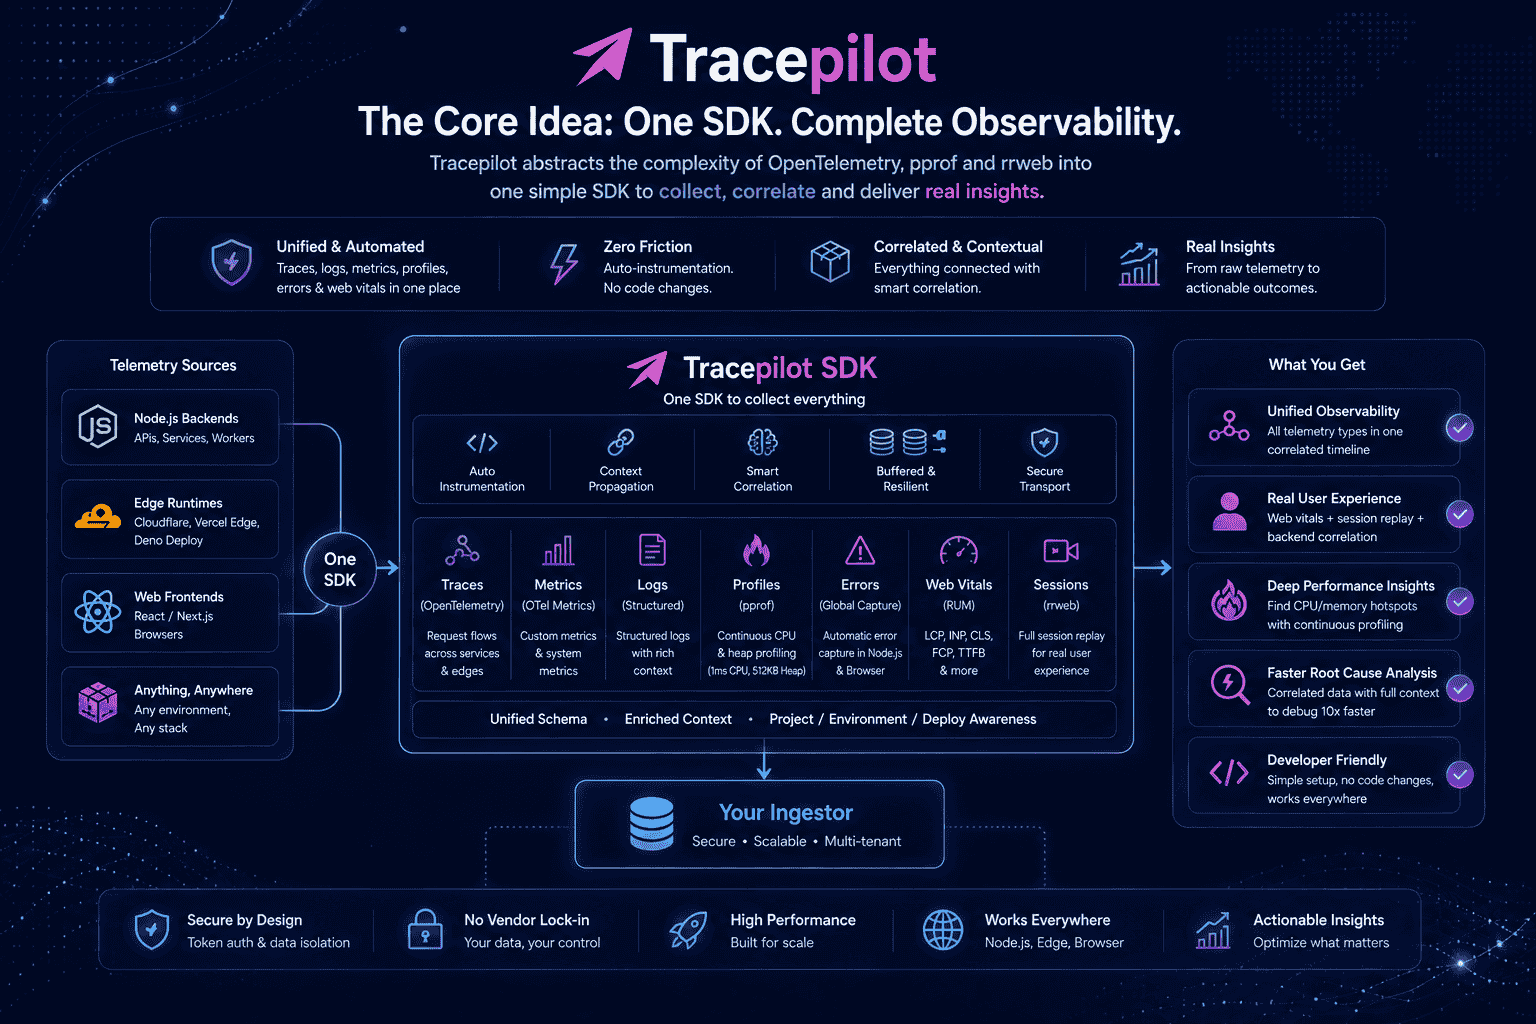
Image copyrights: Tracepilot SDK
Platform Journey
Discovery & Planning
The project began with an in-depth assessment of the client's existing observability workflows, production infrastructure, and monitoring challenges. Based on these findings, we defined the SDK architecture, telemetry strategy, security model, and multi-runtime compatibility requirements.
SDK Development
TracePilot was engineered as a modular, TypeScript-based SDK with native support for Node.js, Express.js, React, Next.js, and Edge Runtime. Automatic instrumentation for distributed tracing, error monitoring, performance profiling, session replay, and Real User Monitoring (RUM) enabled seamless integration with minimal developer effort.
Telemetry Platform
We built a scalable telemetry pipeline capable of securely collecting, batching, and exporting traces, performance data, and custom events. Intelligent buffering, asynchronous processing, and authenticated ingestion ensured reliable, low-overhead telemetry delivery in production environments.
Production Launch & Evolution
Before release, the SDK underwent extensive compatibility testing, performance optimization, and security validation. Following deployment, continuous enhancements focused on expanding framework support, improving automatic instrumentation, and delivering richer observability capabilities to meet evolving production requirements.
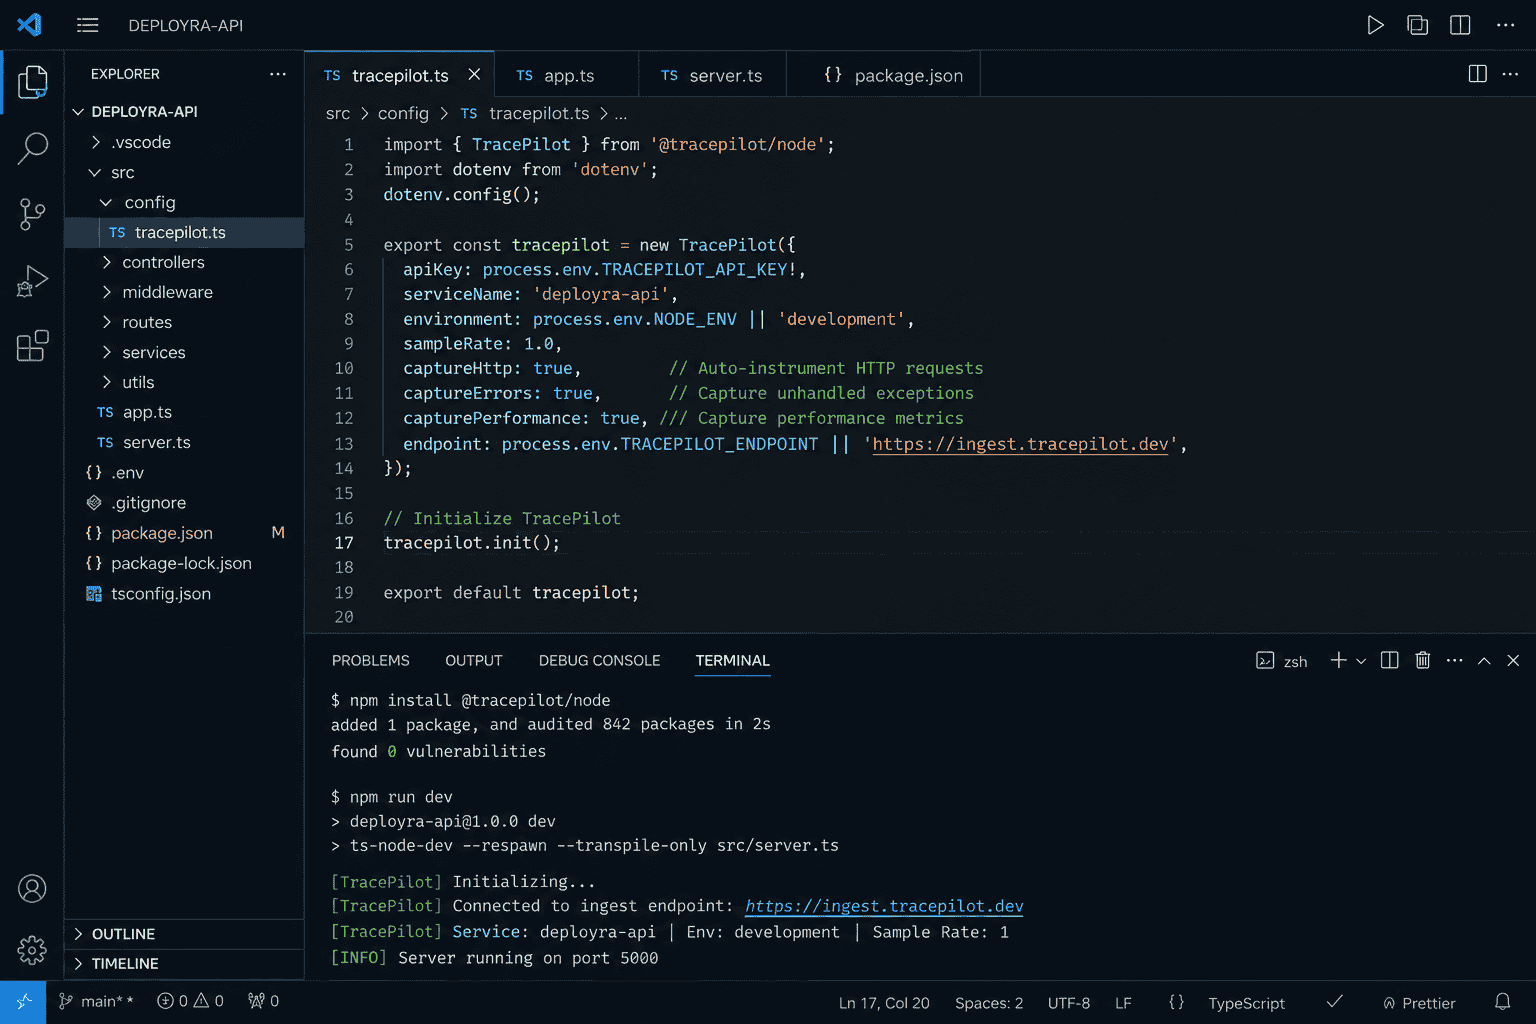
Image copyrights: TracePilot SDK
Results
- Production-ready observability SDK successfully delivered with seamless integration across Node.js, Express.js, React, Next.js, and Edge Runtime environments.
- Unified monitoring platform integrating distributed tracing, error monitoring, continuous profiling, session replay, and Real User Monitoring (RUM) into a single developer-friendly solution.
- Reduced debugging complexity through automatic instrumentation, enabling engineering teams to diagnose production issues with greater speed and accuracy.
- High-performance telemetry pipeline built with intelligent batching, secure data transmission, and low-overhead processing for production-scale applications.
- Improved operational visibility with end-to-end request tracing, actionable performance insights, and comprehensive application diagnostics.
- Scalable cloud-native architecture established to support future observability enhancements, framework integrations, and enterprise workloads.