TracePilot: Unified
Application Observability
Transform application telemetry into engineering intelligence.
Book a demo →Transform application telemetry into engineering intelligence.
Book a demo →TracePilot is an OpenTelemetry-powered observability SDK developed to help engineering teams instrument, monitor, and debug modern applications —without managing the complexity of raw telemetry libraries.
It provides automatic distributed tracing, continuous CPU and memory profiling, global error capture, Real User Monitoring (RUM), Core Web Vitals, and session replay through a unified developer experience that works across Node.js, React, Next.js, and Edge runtimes.
Built around OpenTelemetry standards and optimized for production workloads, TracePilot automatically collects, buffers, authenticates, and exports telemetry while minimizing runtime overhead, enabling teams to understand application behavior from backend services to browser interactions with minimal setup.
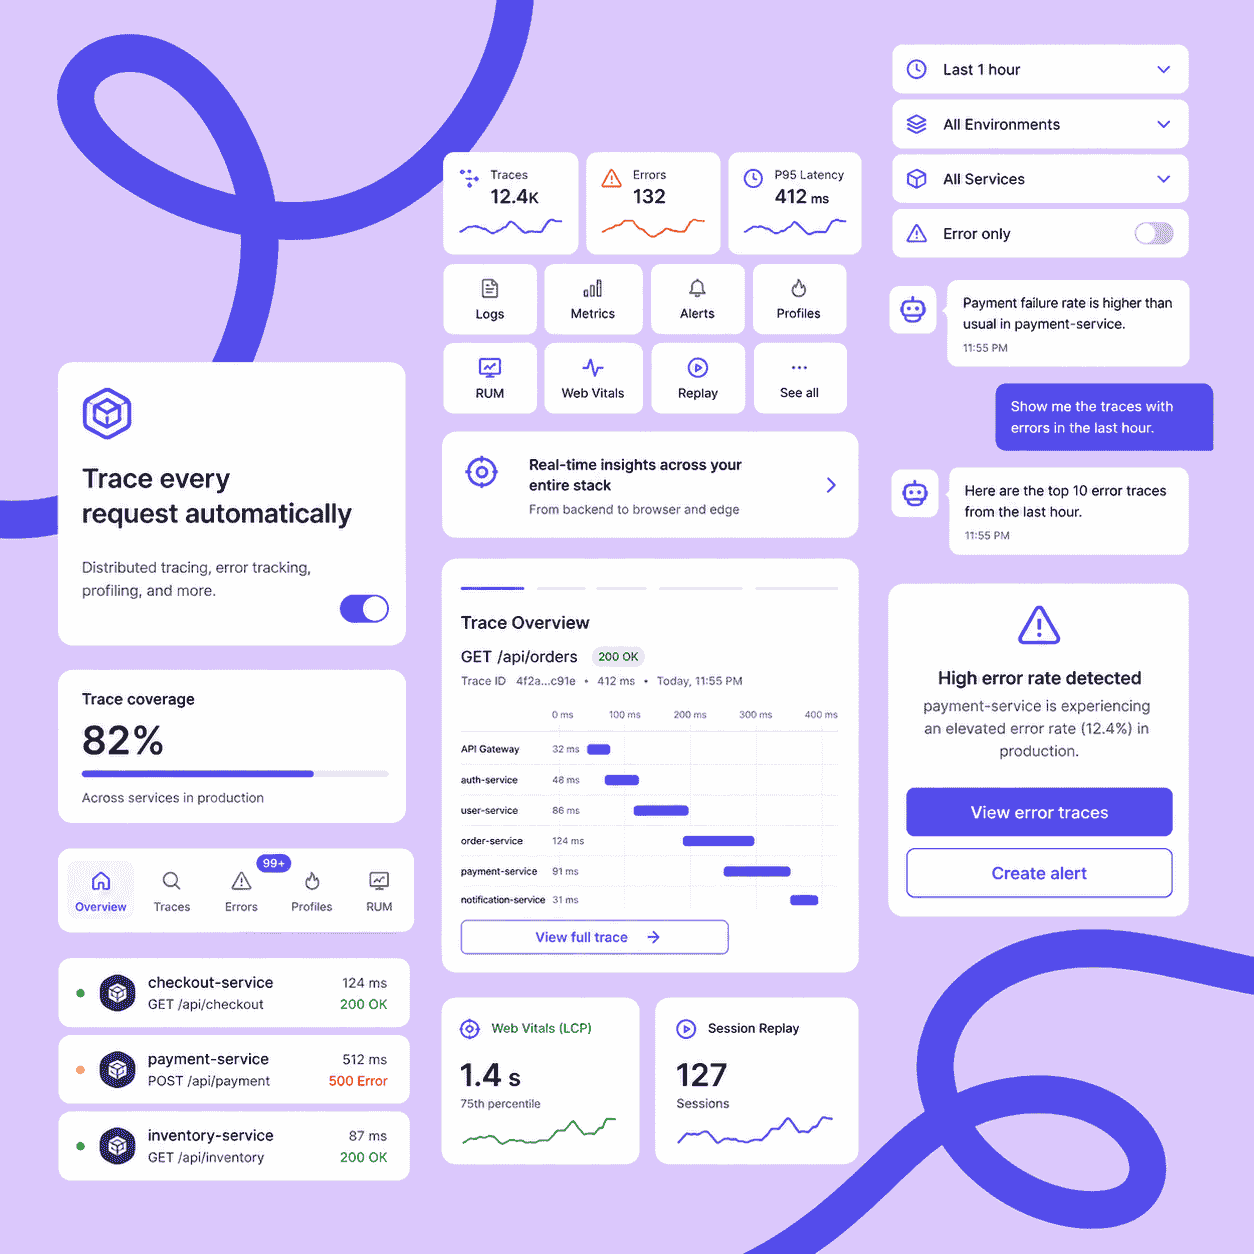
Gain complete application visibility with fast, production-ready observability.
TracePilot helps teams:
TracePilot delivers tracing, profiling, error monitoring, and session replay through a unified SDK—making production observability simple for modern development teams.
A unified observability SDK built to instrument, monitor, and debug applications—capturing traces, performance, errors, and user sessions from one platform.
Automatically capture end-to-end request flows across services, making it easy to identify latency bottlenecks, failed requests, and dependency issues in complex applications.
Monitor CPU and memory usage in production with continuous profiling, helping engineering teams pinpoint performance hotspots before they impact users.
Measure Core Web Vitals, browser performance, and user interactions to understand how real customers experience your application across every session.
Capture uncaught exceptions, unhandled promise rejections, and frontend crashes with complete context, stack traces, and request correlation.
Replay user sessions alongside traces and errors to visually reproduce issues, understand user behavior, and accelerate debugging.
Built on OpenTelemetry standards with automatic instrumentation for Node.js, React, Next.js, and Edge runtimes for seamless observability.
Everything you need to begin monitoring production applications.
Clear up your doubts about agile software development.
TracePilot is an OpenTelemetry-powered observability SDK that helps developers monitor, debug, and optimize applications through distributed tracing, performance profiling, error tracking, Real User Monitoring, and session replay.
TracePilot supports modern JavaScript runtimes and frameworks, including Node.js, React, Next.js, and Edge environments, with automatic OpenTelemetry instrumentation for quick integration.
Most applications can be instrumented in minutes by installing the SDK, adding your project credentials, and enabling automatic instrumentation. TracePilot begins collecting telemetry with minimal configuration.
TracePilot provides distributed tracing, CPU and memory profiling, global error tracking, Core Web Vitals monitoring, Real User Monitoring, session replay, and production performance insights from a single SDK.
Yes. TracePilot is built on OpenTelemetry standards, making it easy to integrate with existing instrumentation while following industry-standard telemetry practices.
Yes. TracePilot is designed for production environments with intelligent batching, asynchronous telemetry processing, and low-overhead data collection to minimize application impact while providing deep observability.
Share your challenge and our team will support you on a journey to deliver a revolutionary digital product
Estimate project